Predicting recessions is a tricky business, but economists and analysts often rely on a combination of historical data, economic indicators, and market sentiment to gauge the likelihood of an economic downturn. As we step into 2025, a range of key indicators in the United States suggests that a recession might be on the horizon. Let’s break down these seven critical warning signals.
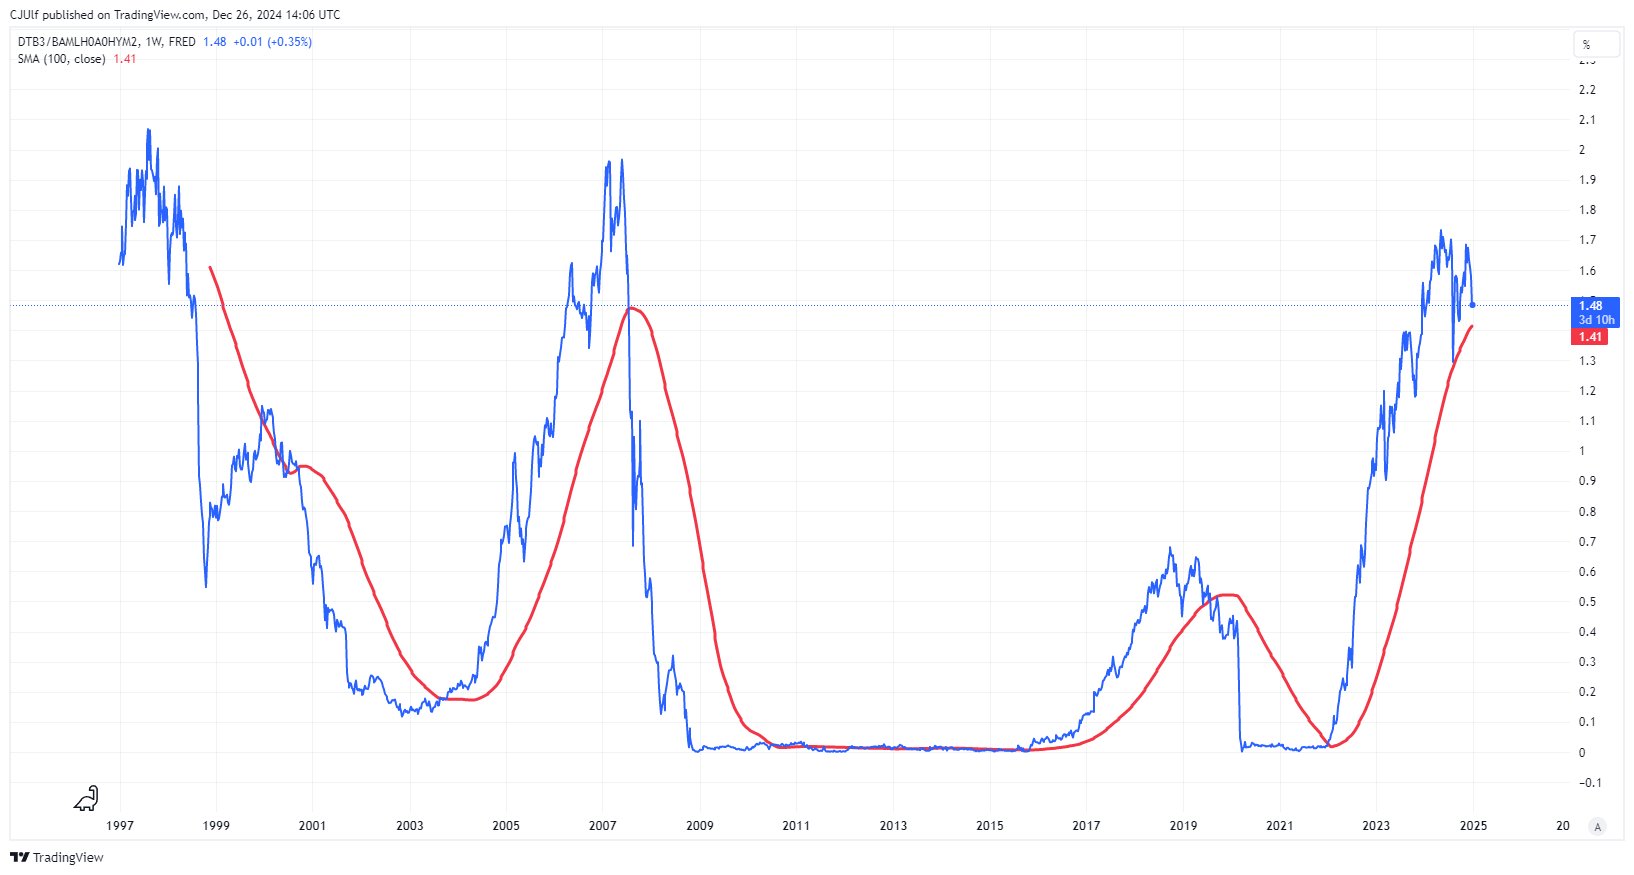
1. The “Blood Indicator”: Treasury Bill/High Yield Spread Ratio
The “Blood Indicator” tracks the ratio of the US 3-month Treasury Bill yield to the High Yield Spread. Historically, this ratio flashing red—when it crosses below the 100-week moving average—has preceded recessions. With this threshold breached, it signals rising financial risk and tighter credit conditions, both harbingers of an economic slowdown.
2. Civilian Employment Year-Over-Year Change
This indicator compares the current number of employed civilians to the number employed one year ago. Remarkably, whenever this metric dips below zero, the U.S. economy has entered a recession without exception (8 out of 8 times). Currently, the trend is moving dangerously close to zero, highlighting a potential slowdown in the labor market.
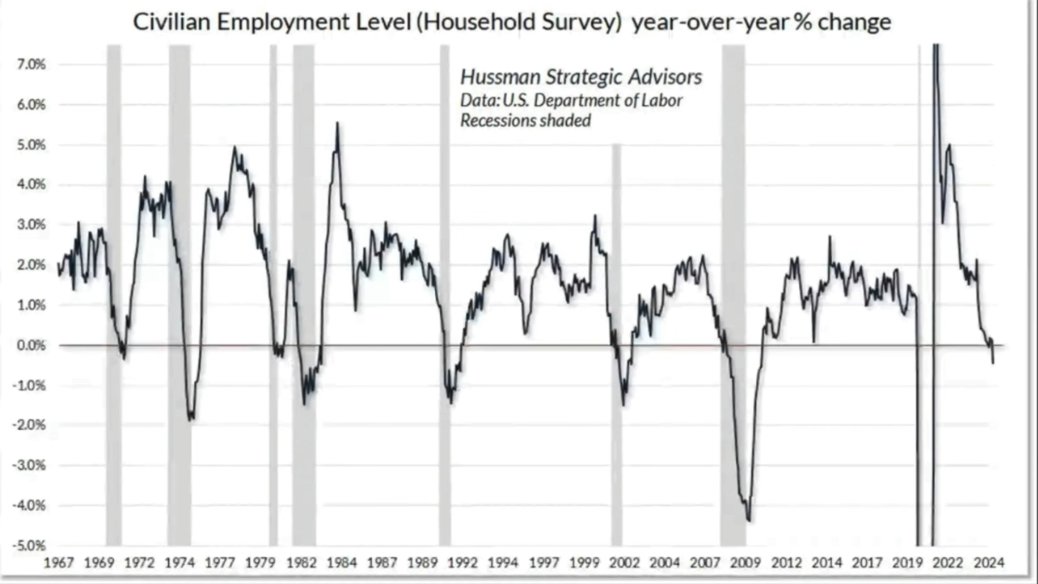
It shows the number of people employed today and how that number compares to the number one year ago.
Every time it drops below zero, we have a US recession.
Note, not one false signal historically (8/8).
3. US Consumer Sentiment
Consumer sentiment reflects how Americans feel about their personal financial situations and the broader economy. A dramatic drop in sentiment has often preceded recessions, and June 2022 marked the lowest sentiment ever recorded. While sentiment has since stabilized, such a sharp decline leaves lasting effects on spending habits and economic growth.
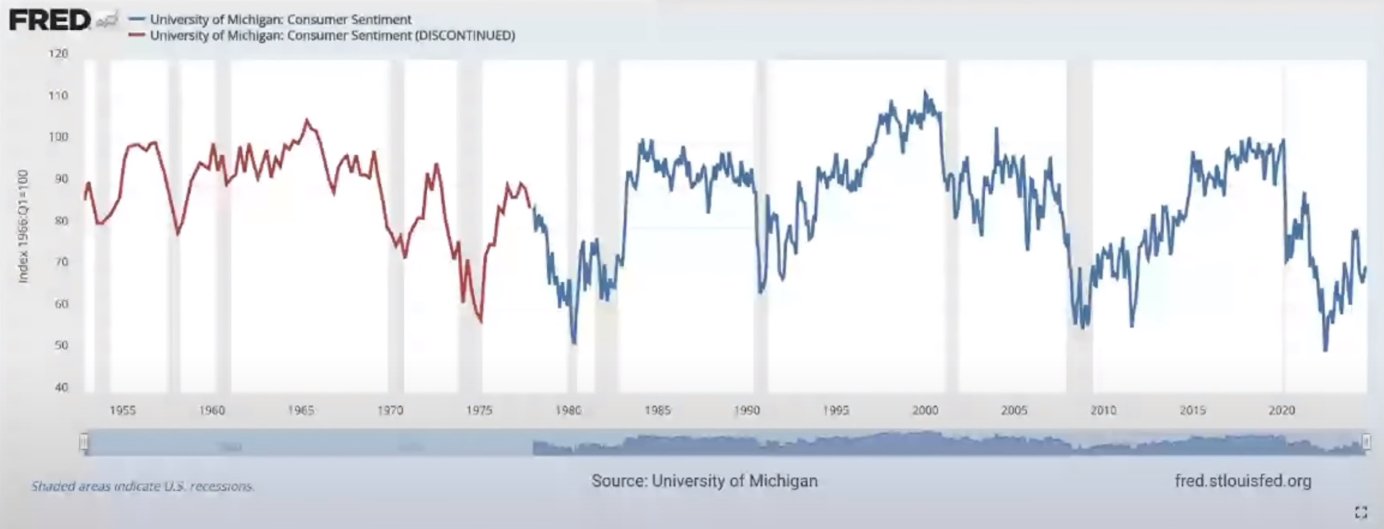
Usually, when we get a big drop in sentiment, we get a recession. June of 2022 was the lowest sentiment ever.
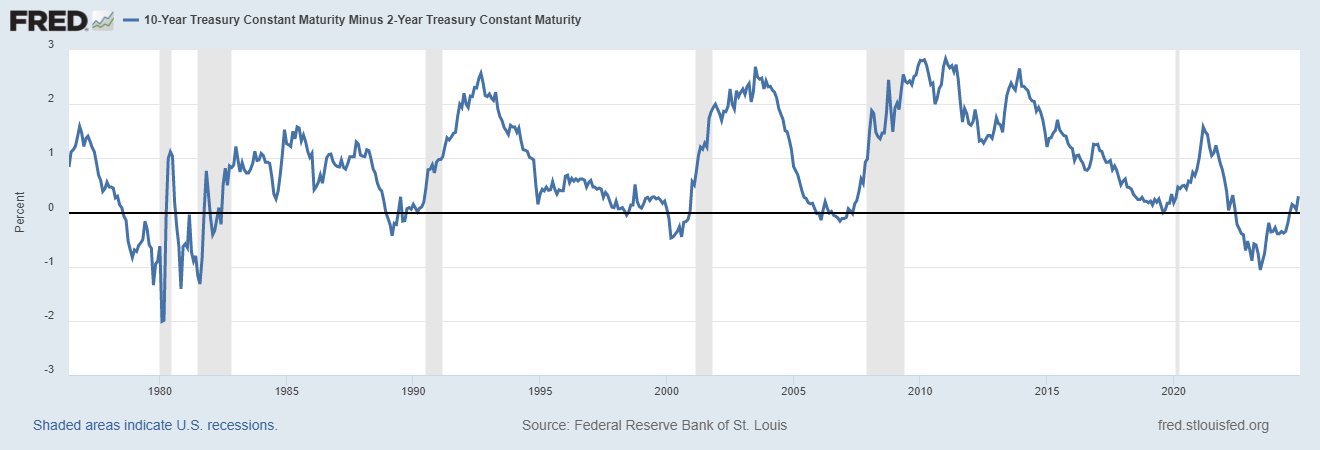
4. The US 2-Year/10-Year Yield Spread
The inversion of the 2-year and 10-year Treasury yield curve has long been a reliable recession predictor. Yield curve inversions occur when short-term rates exceed long-term rates, signaling expectations of a future slowdown. Historically, recessions follow once the curve normalizes. Notably, all yield curve inversions have recently reverted to positive, a potential warning sign that a recession may not be far off.
5. New Orders vs. Unemployment Trends
The relationship between manufacturing new orders and unemployment offers critical insights. When new orders trend downward, unemployment tends to trend upward—a pattern consistently linked to economic downturns. In recent months, new orders have softened while unemployment pressures appear to be mounting, reinforcing the case for a potential recession.
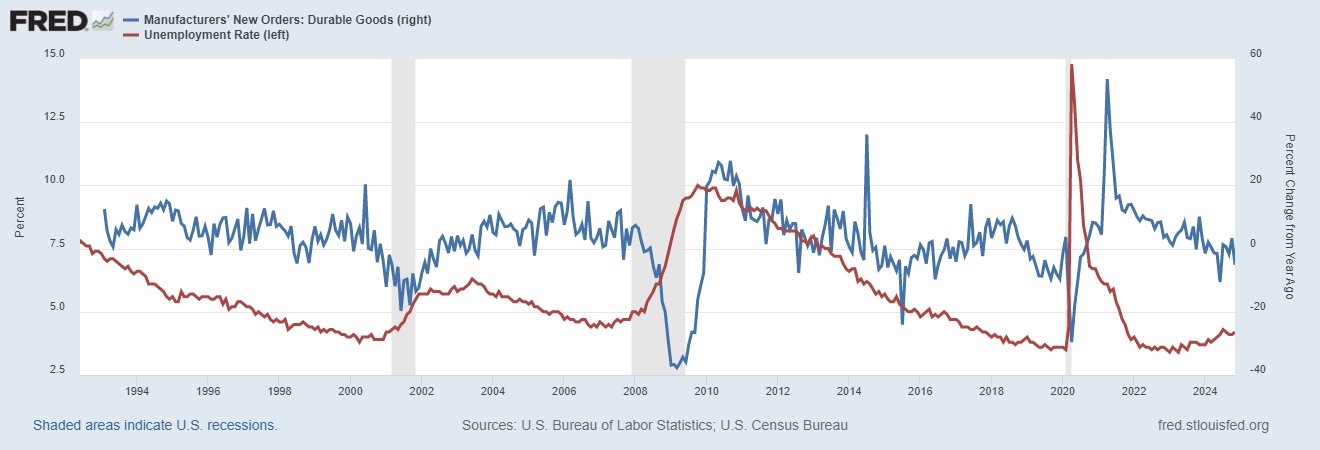
Historically, when the new order trend is down, the unemployment trend is up.
6. The U.S. Unemployment Rate and the Sahm Rule
The U.S. unemployment rate has never increased by more than 0.35 percentage points (on a 3-month average basis) without a recession following. As of late 2024, the unemployment rate has already climbed by 0.80 percentage points since early 2023. Additionally, the Sahm Rule—triggered when the three-month average unemployment rate rises by 0.5 percentage points or more from its 12-month low—has also been met. Together, these metrics present a compelling argument for an impending downturn.
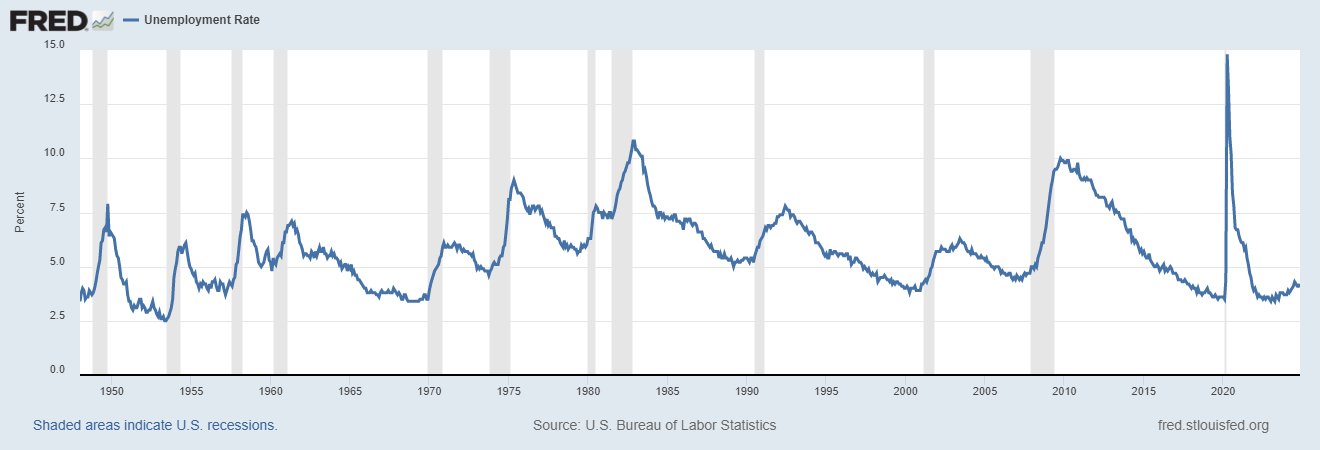
It has never increased by more than 0.35 percentage points (on a 3-month average basis) without the economy going into a recession. Also, the Sahm Rule has been triggered.
The U.S. unemployment rate has increased by 0.80 % points since early 2023.
7. Empire State Manufacturing Survey
The Empire State Manufacturing Survey provides a snapshot of manufacturing activity in New York. January 2024 saw the index drop to its second-lowest level ever—a signal historically associated with recessions. While the index has since rebounded, the earlier drop highlights significant stress within the manufacturing sector.
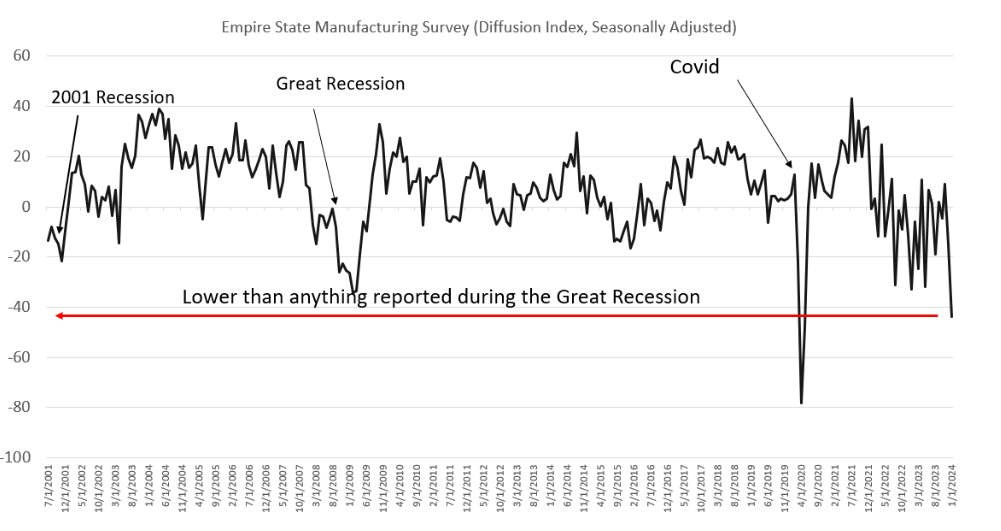
It dropped to the second-lowest in January 2024. Drops of this magnitude have always been connected to recessions in recent decades.
The index has since recovered, latest reading is 0.20.
The Broader Implications
Each of these seven indicators carries historical weight, and together they form a compelling case that a U.S. recession could materialize in 2025. However, predicting exact timing and severity remains uncertain. Policymakers, businesses, and consumers would be wise to prepare for potential disruptions, whether by building financial resilience, diversifying investments, or supporting pro-growth policies.
Recessions are a natural part of the economic cycle, and while they bring challenges, they also pave the way for renewal and innovation. Understanding the signals now allows us to mitigate risks and emerge stronger on the other side.


![OpenAI. (2025). ChatGPT [Large language model]. https://chatgpt.com](https://www.illustratedcuriosity.com/files/media/55124/79bc18fa-f616-4951-856f-cc724ad5d497-560x416.webp)
![OpenAI. (2025). ChatGPT [Large language model]. https://chatgpt.com](https://www.illustratedcuriosity.com/files/media/55099/2638a982-b4de-4913-8a1c-1479df352bf3-560x416.webp)






![OpenAI. (2025). ChatGPT [Large language model]. https://chatgpt.com](https://www.illustratedcuriosity.com/files/media/55136/b1b0b614-5b72-486c-901d-ff244549d67a-350x260.webp)
![OpenAI. (2025). ChatGPT [Large language model]. https://chatgpt.com](https://www.illustratedcuriosity.com/files/media/55124/79bc18fa-f616-4951-856f-cc724ad5d497-350x260.webp)
![OpenAI. (2025). ChatGPT [Large language model]. https://chatgpt.com](https://www.illustratedcuriosity.com/files/media/55099/2638a982-b4de-4913-8a1c-1479df352bf3-350x260.webp)
