In 1872 the United States overtook the United Kingdom as the world’s largest economy. And since then, the United States has remained quite unchallenged as number one. Until now?
During the late 1970s, China began implementing new economic policy’s and open up to the outside world. The policy’s proved successful and the country became the world’s fastest-growing major economy, with economic growth rates averaging 10% over the past 30 years. With such a large population (1,350,695,000 in 2012), every small increase of its capital stock paid huge dividends (Y=AKL).
That China one day will pass the United States as the world largest economy is regarded as inevitable. And just the other week the International Comparison Program – including organizations such as the World Bank and the United Nations – reported that China’s economy in 2011 constituted 87 percent of the US economy.
In 2005 China accounted for only 43 percent of the US economy according to the same source. However, the financial crisis hit in 2008, and with an economic downturn and recession that hit the U.S. and Europe worse than China – which continued to grow at rates around 10 percent per year – the relative size of the gap has kept closing rapidly.
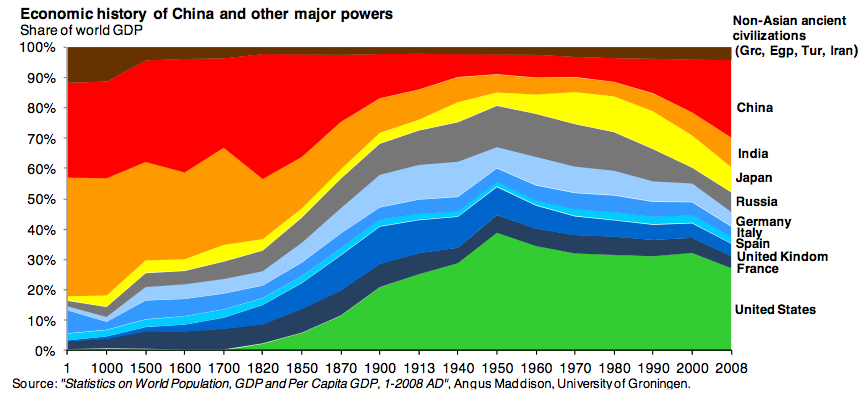
And now the International Comparison Program report that China has passed the United States in total GDP. This when using a measure to compare economies via purchasing power, called “Purchasing Power Parity” (PPP).
The purchasing power adjusted method does not take into account exchange rates as the most traditional manner of measuring GDP does. Instead, it adjusts the rate against the price of a set of goods and services in each country. The concept of PPP allows the estimation of what the exchange rate between two currencies would have to be in order for the exchange to be at par with the purchasing power of the two countries’ currencies. That is, PPP exchange rates help to minimize misleading international comparisons that can arise with the use of market exchange rates.
And measuring GDP in PPP has a major advantage in that aspect, since for example if a country’s currency falls to 10 percent during a year against the dollar, this does not necessarily imply that the country has become 10 percent poorer that year. It is especially relevant when comparing the United States and China since the U.S. often state that China keeps its currency undervalued, which of course would mean a smaller size calculated in dollars.
PPP implies a large “advantage” for poorer (GDP/Capita) countries like China and India since goods and services are much cheaper there than for example in the United States or Japan. And actually, in terms of PPP, India has now surpassed Japan as the world’s third-largest economy according to the International Comparison Program. However, in terms of nominal GDP, India is “only” the world’s tenth largest economy.
Using the more traditional standards of measuring and calculating GDP with exchange rates rather than purchasing power – the United States will continue to be number one for more than a decade to come. Since if China continues to grow at around 7 percent a year. In that case, it would take about a decade to double GDP, and the Chinese economy would then represents the size of the American economy as of today.
All this is is perhaps much more of an interesting fact for curiosity than meaningful facts for ordinary people. A much more important measure for any nation is the size of its population compared to the size of its economic output (GDP). Since if the quality of life is what matters, GDP per capita is much more relevant. And using the International Comparison Program recent data calculated with PPP (thus benefiting poorer countries), the United States ends up at a twelfth place in terms of GDP per capita, China at 99th place and India at the 127th place. Also, the income differences are also much larger in Communist China than compared to the United States.
_______________
IMF Growth Rates
Trade: China and the West
International Comparison Program (ICP)
_______________

![OpenAI. (2025). ChatGPT [Large language model]. https://chatgpt.com](https://www.illustratedcuriosity.com/files/media/55124/79bc18fa-f616-4951-856f-cc724ad5d497-560x416.webp)
![OpenAI. (2025). ChatGPT [Large language model]. https://chatgpt.com](https://www.illustratedcuriosity.com/files/media/55099/2638a982-b4de-4913-8a1c-1479df352bf3-560x416.webp)



![OpenAI. (2025). ChatGPT [Large language model]. https://chatgpt.com](https://www.illustratedcuriosity.com/files/media/55136/b1b0b614-5b72-486c-901d-ff244549d67a-350x260.webp)
![OpenAI. (2025). ChatGPT [Large language model]. https://chatgpt.com](https://www.illustratedcuriosity.com/files/media/55124/79bc18fa-f616-4951-856f-cc724ad5d497-350x260.webp)
![OpenAI. (2025). ChatGPT [Large language model]. https://chatgpt.com](https://www.illustratedcuriosity.com/files/media/55099/2638a982-b4de-4913-8a1c-1479df352bf3-350x260.webp)
